The available Market Data Displays are listed below.
Once you have set up your Market Data Displays, you can publish them to a variety of locations to show details about the real estate market in your area. Once published, these displays are updated monthly to ensure they are current and accurate. For more information on where you can publish the displays, see "About Market Data".
The following four graphs are available. Click an item below to view a description and example.
Note: All graphs are for a single property type unless otherwise noted.
This table provides some more details about the data source and how it's retrieved.
Market data displays |
Data source |
data retrieved |
Additional details |
|
Data from various sources (listings, public data, etc) is retrieved. |
Active listing data is analyzed to provide statistics. |
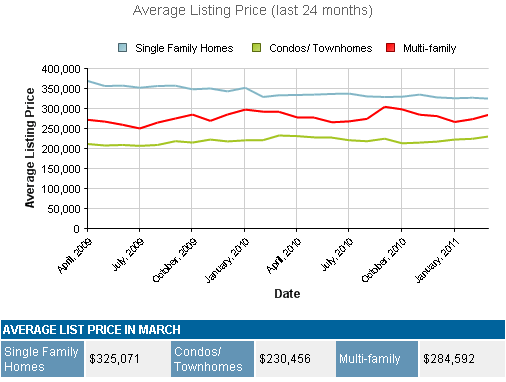
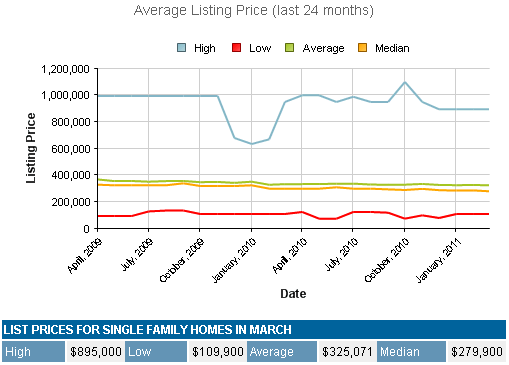
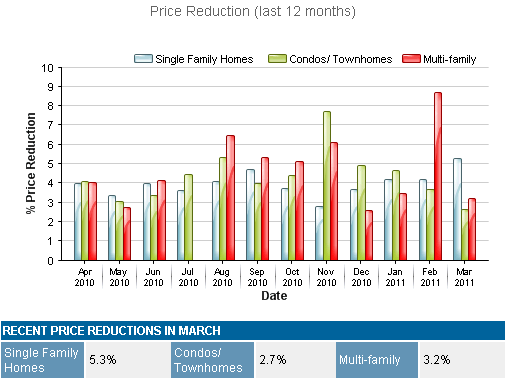
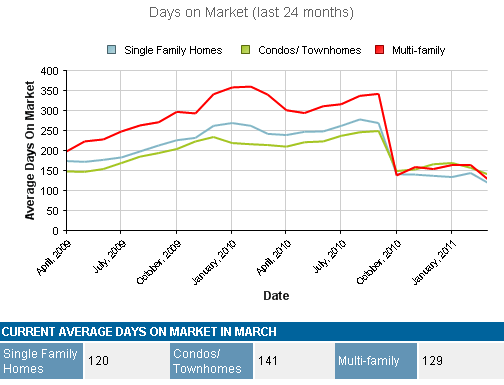
Below each graph, a table displays average values that summarize the findings in the graph. |
![]()